The Scale of the Problem: U.S. Wildfire Data in Numbers
Wildfires have always been part of North America's natural ecosystem. But the scale, intensity, and geography of wildfire activity in the United States has shifted dramatically over the past four decades. Understanding why requires looking at the physical, ecological, and policy factors that have converged to create conditions fundamentally different from those of even a generation ago.
Cause #1 — Climate Change and the Drying of the American West
The relationship between climate change and wildfire is not speculative — it is measured in fuel moisture data, fire weather indices, and burn scar records. Rising average temperatures directly reduce the moisture content of live and dead vegetation. When dead fuel moisture drops below 10%, fire scientists describe conditions as comparable to kiln-dried lumber. When it drops below 5%, fire becomes nearly impossible to suppress through conventional means.
The Palmer Drought Severity Index and the Energy Release Component (ERC) — a metric used by fire weather forecasters to express how readily fuels will combust — have both trended toward more severe values across the western U.S. over the past 40 years. The western fire season has lengthened by approximately 78 days compared to the 1970s, according to research published in Proceedings of the National Academy of Sciences.
| Decade | Avg. Annual Acres Burned (U.S.) | Avg. Fire Season Length | Notable Change |
|---|---|---|---|
| 1980s | ~2.5 million | ~150 days | Baseline era; suppression policy dominant |
| 1990s | ~3.3 million | ~165 days | Drought years begin extending season |
| 2000s | ~6.8 million | ~195 days | 2000 and 2006 set records; WUI losses accelerate |
| 2010s | ~7.6 million | ~220 days | Mega-fires become routine; Camp Fire (2018) |
| 2020–2023 | ~8.9 million | Near year-round in CA, AZ, TX | Three of five highest-acreage years on record |
Critically, warmer temperatures do not just dry existing fuels — they create feedback loops. Drought stress kills trees, converting living fuel to standing dead fuel. Bark beetle populations, which historically were controlled by cold winters, now survive year-round and kill millions of additional trees annually across the Intermountain West, adding to the fuel load.
Cause #2 — A Century of Fire Suppression
Beginning with the U.S. Forest Service's "10 a.m. policy" in the early 20th century, federal land management agencies made it the goal to extinguish every wildfire by 10 a.m. the morning after detection. This policy was operationally effective — but ecologically catastrophic in the long term.
Before European settlement, fire ecologists estimate that low-to-moderate intensity surface fires burned through western forests on a return interval of roughly 5–35 years, depending on forest type and region. These fires cleared understory brush, consumed accumulated dead wood, and maintained the open park-like stand structures that characterized pre-settlement forests. They were the natural reset mechanism for fuel loads.
Pre-suppression era forests (pre-1900)
- Frequent low-intensity surface fires every 5–35 years
- Open, park-like understory structure
- 20–50 trees per acre typical in ponderosa pine forests
- Fuel loads within range that fire could clear
- Fire-adapted species composition
Post-suppression forests (today)
- Fires suppressed for 80–120 years in many stands
- Dense, multi-story canopy with continuous fuel ladder
- 200–400+ trees per acre in formerly open stands
- Fuel accumulation 3–10× historical baseline
- Bark beetle-killed standing dead trees throughout
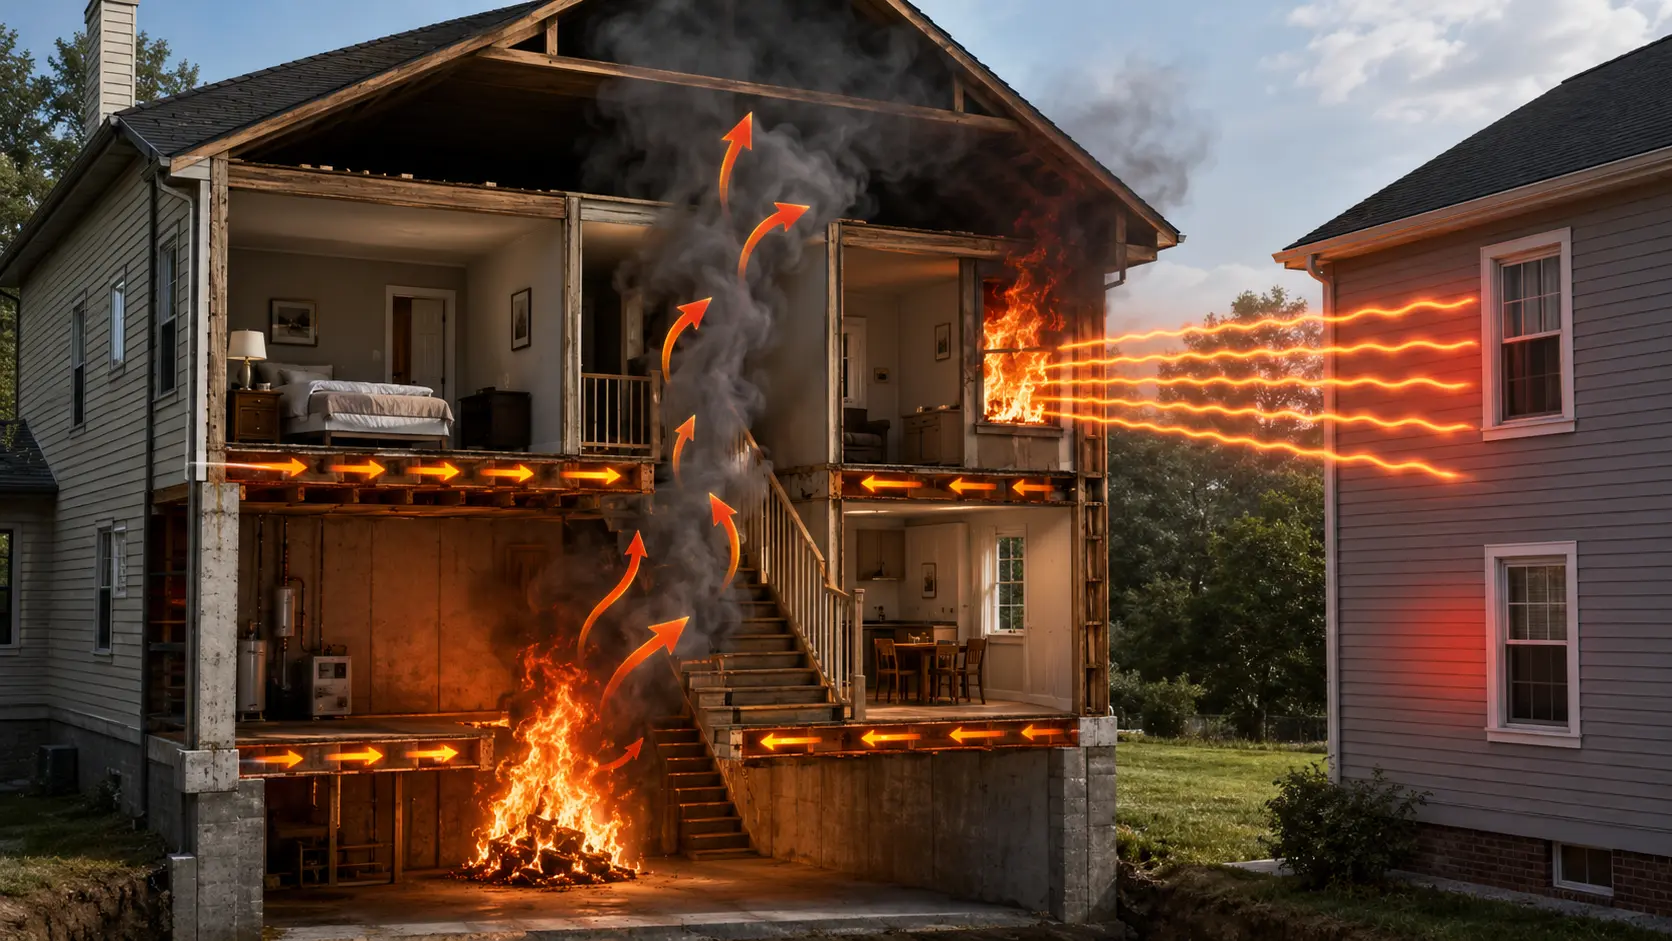
When fire ignites in a dense, fuel-loaded stand, it does not burn as a surface fire — it climbs fuel ladders into the canopy and becomes a crown fire, burning at temperatures that kill entire forest stands and generate plume dynamics that create their own weather systems (pyrocumulonimbus clouds). These fires are not controllable by direct attack and can grow by tens of thousands of acres per day.
For a detailed look at how fire investigators analyze burn patterns and determine origin in these environments, see our guide on wildland fire investigations in the U.S.
Cause #3 — Drought and Dead Fuel Accumulation
The western United States has experienced what paleoclimatologists describe as a megadrought — a drought comparable in severity and duration to those documented only once or twice per millennium in tree ring records — since approximately 2000. The Colorado River Basin, which supplies water to 40 million people, has seen reservoir levels drop to historic lows.
For fire purposes, extended drought affects fuels in several compounding ways:
- Dead fuel moisture collapse: Multi-year drought drives fine dead fuel moisture into the extreme danger range even without recent hot, dry weather
- Live fuel desiccation: Shrubs and trees under water stress have lower live fuel moisture — even "green" vegetation becomes flammable
- Massive tree die-off: Drought-stressed trees succumb to bark beetle attack en masse; the Sierra Nevada alone saw 150 million trees die between 2012 and 2019
- Grass invasion: Invasive annual grasses (cheatgrass, buffelgrass) colonize areas disturbed by drought and fire, creating continuous fine fuel sheets that carry fire at extreme rates of spread
Cause #4 — Wildland-Urban Interface Expansion
The Wildland-Urban Interface (WUI) is the zone where human development meets or intermingles with wildland vegetation. It is the fastest-growing land use type in the United States, driven by population migration toward scenic, forested, and rural landscapes — particularly in western mountain communities and the suburban expansion of cities like Denver, Phoenix, Boise, and Bend.
| Factor | What It Means for Fire Risk | What It Means for Firefighters |
|---|---|---|
| Structures in fire path | Homes ignite and spread fire to adjacent homes | Resources diverted from containment to structure protection |
| Human ignition sources | Power lines, vehicles, debris burning, equipment sparks | More ignitions during peak fire weather windows |
| Access and egress | Single-road subdivisions create evacuation bottlenecks | Civilian evacuation conflicts with fire apparatus access |
| Ornamental vegetation | Non-native landscaping creates continuous fuel near structures | Structure-to-structure fire spread accelerates |
| Utility infrastructure | Power lines through fire-prone terrain — arcing, contact | Power shutoffs (PSPS) complicate communications and pumping |
The WUI creates a compounding problem: it concentrates both more ignition sources and more at-risk structures in the same landscape. The 2018 Camp Fire — which killed 85 people and destroyed nearly 19,000 structures — occurred when a transmission line failed under high-wind conditions in a heavily WUI-developed foothill community with a single primary evacuation route.
Cause #5 — Wind: The Most Dangerous Variable
Wind is the most operationally dangerous factor in wildfire behavior. Its effects are immediate, extreme, and highly localized in complex terrain. Two wind-driven fire events deserve specific attention in the western U.S. context:
Santa Ana Winds (Southern California): Offshore, downslope winds that originate in the Great Basin and compress and heat as they descend through mountain passes. They routinely reach 40–80 mph, with measured gusts over 100 mph, typically during October through December — after the driest part of summer. Relative humidity during Santa Ana events can drop to single digits. Nearly every major Southern California fire disaster has occurred during a Santa Ana event.
Diablo Winds (Northern California): Similar offshore downslope wind pattern affecting the San Francisco Bay Area and North Coast ranges. The 2017 North Bay fires (Tubbs, Nuns) and the 2019 Kincade Fire all ignited during Diablo wind events. These winds are associated with the utility-caused fire ignitions that led to billions of dollars in liability for Pacific Gas & Electric.
Beyond California, downslope Chinook winds in the Rockies, Great Plains wind events, and the Sundowner winds of the Santa Barbara region all create similar conditions: high wind, low humidity, and fire spread rates that outpace suppression capacity.
Cause #6 — Extended Fire Season (Now Year-Round)
Fire agencies across the western U.S. have formally abandoned the concept of a discrete "fire season" in favor of year-round readiness. The evidence supports this:
- December 2021The Marshall Fire in Boulder County, Colorado burned 1,084 homes on December 30 — the most destructive fire in Colorado history — driven by 100-mph wind gusts in near-zero humidity conditions following a snowless fall.
- January 2025The Palisades and Eaton fires in the Los Angeles area ignited during a powerful Santa Ana wind event in January, destroying thousands of structures and killing multiple people during what was historically considered the off-season.
- February–MarchGrass fires driven by winter drought and wind regularly cause significant damage across Texas, Oklahoma, and Kansas during late winter and early spring, well before traditional fire season metrics would indicate elevated risk.
- Year-round in FloridaFlorida averages more individual fire ignitions than any other state — primarily lightning-caused grass and pine flatwood fires — distributed across all 12 months due to its climate.
What Firefighters Are Doing Differently
Fire agencies at federal, state, and local levels have adapted operational doctrine, equipment, and staffing in response to the changed fire environment. Key adaptations include:
| Adaptation | Description |
|---|---|
| Year-round staffing | Federal fire crews maintained on Extended Attack pay status outside historical peak season windows |
| Pre-positioning resources | Air tankers, helicopters, and hand crews pre-positioned ahead of forecast high-risk weather events |
| Rapid Ignition Response | "Initial attack aggressive" doctrine — maximum resources on new starts within first 24 hours to prevent size-up to project fire |
| Structure triage | Formal protocols for identifying which structures are defensible for protection and which must be abandoned to maintain crew safety |
| Community Risk Reduction | Fire departments delivering defensible space inspections, Firewise USA community certification, and home hardening assessments before fire season |
| Prescribed fire programs | Expanded controlled burn programs to reduce fuel loads, supported by 2022 federal Bipartisan Infrastructure Law funding |
What Families Can Do Right Now
Understanding why fires are worse does not change the immediate actions available to families. The good news is that preparedness measures are well-established and effective. Homes with completed defensible space and hardened construction have survived in subdivisions where neighboring unprepared homes burned — this is documented across California fire events.
- Know your evacuation zone — look it up by address on your county OES or Sheriff's website today
- Sign up for your county's emergency alert system (Nixle, Everbridge, CodeRED, or equivalent)
- Build a 72-hour go-bag with water, food, medications, documents, and N95 masks
- Create and practice a family communication plan including two evacuation routes and an out-of-area contact
- Establish defensible space: clear Zone 1 (0–30 ft) and Zone 2 (30–100 ft) of dead vegetation before fire season
- Clean gutters and roof of accumulated debris — ember landing on dry leaf matter is the most common home ignition pathway
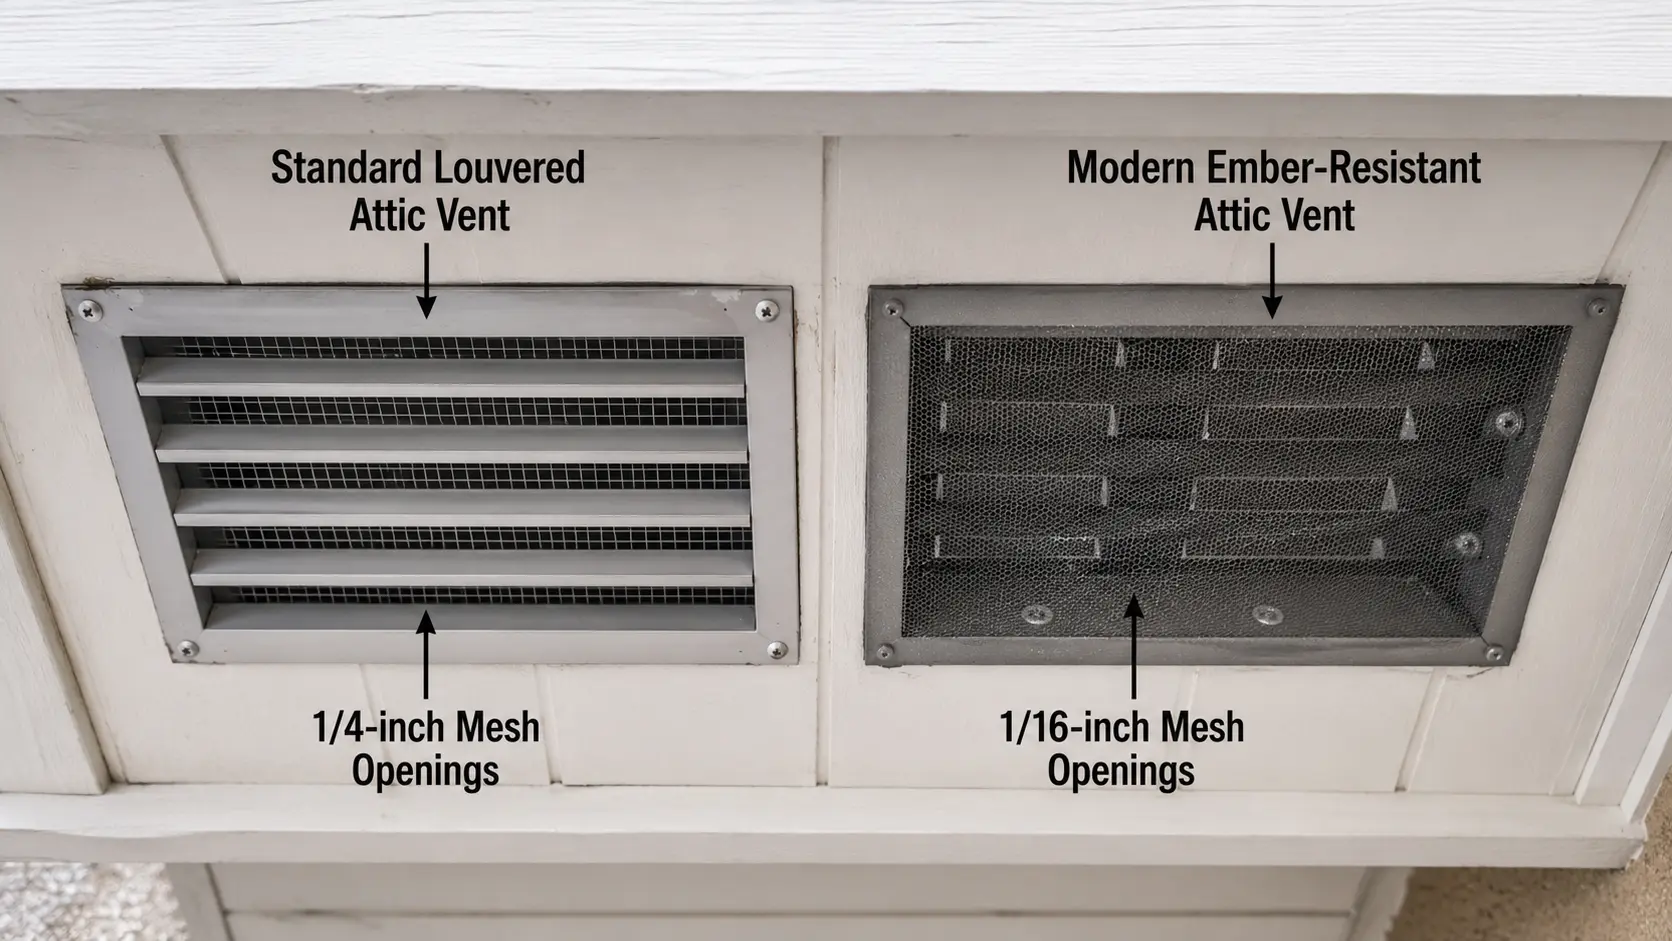
- Install ember-resistant vents and close all openings that embers could enter during a fire event
- Move propane tanks, firewood, and combustible furniture away from the structure
- Monitor the National Weather Service Fire Weather forecast and Air Quality Index during fire weather events
For a complete step-by-step evacuation protocol — including what to do when an order is issued, how to leave safely, and how to return after a fire — see our full wildfire evacuation guide for families.
The Path Forward: Prescribed Fire, Forest Management, and Community Resilience
There is no single solution to the worsening wildfire problem. But fire scientists, land managers, and emergency management professionals broadly agree on the components of a credible long-term strategy:
Prescribed fire at scale is the most cost-effective fuel management tool available. Research shows that every dollar invested in prescribed burning saves approximately $5–$30 in future suppression and damage costs. The 2022 Bipartisan Infrastructure Law provided $600 million specifically for hazardous fuels reduction and $200 million for burned area reforestation. The USDA Wildfire Crisis Strategy targets treating 50 million acres of federal land within 10 years — a significant increase from historical treatment rates.
Building code reform in WUI areas — requiring fire-resistant roofing, ember-resistant vents, and ignition-resistant construction as minimum standards rather than optional upgrades — can dramatically reduce structure ignition rates. California has moved furthest in this direction with Chapter 7A of the California Building Code, but adoption varies widely by state.
Land use planning that limits new development in highest-risk WUI zones and requires demonstration of adequate fire safe road access and water supply before approvals are granted addresses the root cause of community-scale fire risk growth.
For operational reference tools used by firefighters and incident commanders responding to wildland fires — including fire flow calculators, SCBA air time tools, and hazardous material identification — see the AllFirefighter Tools section. For hazardous material reference relevant to industrial sites, propane, and chemical exposure in post-fire environments, visit the Hazmat Hub.
Comments 0
No comments yet. Be the first to share your thoughts!
Leave a Comment