Firefighter Line of Duty Deaths: Statistics, Causes, and What the Data Tells Us
Every year, the U.S. Fire Administration publishes its annual firefighter fatality report. Every year, the fire service community reads it, discusses it at conferences and in stations, and then — too often — returns to the same practices that produced those numbers. The data is not new. The patterns are not surprising. What is surprising is how much of the death toll remains preventable, year after year, because the interventions are known and the will to implement them consistently is not always there.
This guide is a thorough examination of what the LODD data actually shows — not just the headline numbers, but the patterns by cause, by activity, by age, by department type, and over time. Understanding the data is the first step toward changing it.
Jump to:Annual fatality numbers · Causes of death · Cardiac deaths in detail · Traumatic deaths · By activity at time of death · 30-year trends · Career vs volunteer comparison · Demographics · What the data says about prevention · FAQ
Annual Firefighter Fatality Numbers
The United States loses between 60 and 115 firefighters in the line of duty each year, according to data collected by the U.S. Fire Administration (USFA) and the National Fallen Firefighters Foundation (NFFF). The variation year to year reflects both statistical fluctuation and the impact of specific large events — mass casualty incidents, major wildland fire seasons, and occasional multiple-fatality structural fires.
The trend over 30 years has been meaningfully positive. In the early 1990s, annual LODD totals regularly exceeded 100 and sometimes approached 150. By the 2010s, the figure had dropped to the 60–100 range and has generally stayed there. This represents genuine progress — the result of improved PPE standards, better incident command training, NFPA 1710/1720 staffing standards, and increased cardiovascular health awareness. But 60–100 preventable deaths per year is not a success story. It is an ongoing crisis with a body count.
Data sources for U.S. LODD statistics: The U.S. Fire Administration (USFA) publishes an annual report at usfa.fema.gov. The National Fallen Firefighters Foundation (NFFF) maintains a memorial at firehero.org. The International Association of Fire Fighters (IAFF) tracks career firefighter deaths separately. These sources use slightly different inclusion criteria, which is why numbers sometimes differ across reports.
Causes of Firefighter LODDs
LODD causes are classified into several categories that reveal very different risk profiles and intervention opportunities:
| Cause of death | Approximate % of annual LODDs | Trend (30-year) |
|---|---|---|
| Sudden cardiac death / cardiac event | 40–50% | Persistent — has not declined proportionally |
| Traumatic injury (structure collapse, burns, falls) | 20–30% | Declining — improved PPE and training |
| Vehicle crashes (apparatus or personal vehicle) | 15–20% | Declining but still significant |
| Caught/trapped (structural entrapment) | 5–10% | Declining — improved building construction awareness |
| Stroke | 3–5% | Relatively stable |
| Asphyxiation / smoke inhalation | 2–5% | Declining — SCBA compliance improvements |
| Other / miscellaneous | 5–10% | Variable |
The most striking feature of this table is the persistence of cardiac death as the dominant cause. While traumatic deaths from structural collapses, vehicle crashes, and entrapments have declined meaningfully over three decades — reflecting genuine improvements in PPE, training, and incident command — sudden cardiac death has remained stubbornly dominant. This tells us that the fire service has become significantly better at preventing the traumatic deaths that make news coverage, while the cardiovascular deaths that kill more people continue largely unaddressed.
Cardiac Deaths: A Closer Look
Of the 40–50% of LODDs attributed to cardiac causes, the vast majority are sudden cardiac arrest — typically from acute myocardial infarction (heart attack) or ventricular fibrillation triggered by the extreme physiological demands of firefighting in a person with pre-existing coronary artery disease.
The patterns within cardiac LODDs are revealing:
- Age concentration: Cardiac LODDs peak sharply in the 45–64 age range. The 45–54 decade is particularly deadly — old enough to have developed significant coronary artery disease, but often still physically active and not yet subject to regular cardiac screening.
- Activity timing: Approximately 32% of cardiac LODDs occur during fire suppression operations. Another significant cluster occurs during training — where physical demands mirror actual operations. A surprising proportion occur in the post-incident period, during overhaul and after returning to the station, when the abrupt transition from maximal exertion back to rest can trigger arrhythmia.
- No prior history: In approximately 50% of firefighter cardiac LODDs, the firefighter had no documented prior cardiac history. Their first symptom was their last call. This underscores why screening matters — the absence of known history is not the same as the absence of disease.
- Obesity and metabolic syndrome: Studies of firefighter cardiac LODDs consistently find elevated rates of overweight, obesity, hypertension, and diabetes in the decedents. These are modifiable risk factors.
Traumatic Deaths: The Progress and the Remaining Gaps
Traumatic LODDs — deaths from structural collapse, burns, falls, caught/trapped events, and direct fire exposure — have declined substantially over 30 years. This is one of the fire service's genuine success stories. The contributing factors include improved structural firefighting PPE under successive editions of NFPA 1971, better building construction awareness training, improved RIT protocols and rapid intervention capabilities, enhanced incident command and accountability systems, and the shift away from aggressive interior operations in buildings with lightweight construction under heavy fire conditions.
But gaps remain. Structural collapse remains a significant cause of traumatic LODD, and a disproportionate number of these deaths occur in older career and volunteer firefighters who may not have received training on modern lightweight construction hazards. Falls from heights — during aerial operations, roof operations, and ladder work — continue at a level that suggests inconsistent fall protection protocol adherence. And post-incident vehicle crashes on the drive home after a night shift represent a preventable toll that has only recently received serious attention from the fire service community.
LODDs by Activity at Time of Death
| Activity | % of LODDs | Key risk factor |
|---|---|---|
| Fire suppression (structural) | ~30% | Cardiac, structural collapse, trapped |
| Training activities | ~15% | Cardiac, trauma (mirrors operational risks) |
| Responding to / returning from alarms | ~20% | Vehicle crashes — both apparatus and personal vehicles |
| Non-emergency operations | ~15% | Cardiac events at station, during administrative duty |
| EMS operations | ~8% | Vehicle crashes, violence, cardiac |
| Wildland firefighting | ~5% | Burnover, cardiac, vehicle/aircraft |
| Other / miscellaneous | ~7% | Variable |
The training category deserves specific attention. Training deaths — at 15% of the total — represent deaths that occur in environments specifically designed to be controlled and safe. The fact that 15% of firefighters die while training (rather than responding to actual emergencies) is a stark reminder that safety culture must be embedded in every evolution, every drill, every live burn. Complacency in training environments is deadly.
The "responding and returning" category — vehicle crashes — remains stubbornly significant despite decades of apparatus safety programs. Both apparatus crashes during emergency response and personal vehicle crashes during the commute home after night shifts contribute. Post-shift fatigue driving is a recognized risk that departments have been slow to address with policy — things like mandatory rest periods before driving, station nap pods for post-shift recovery, or ride-share incentives for fatigued crew members.
30-Year Trend Analysis
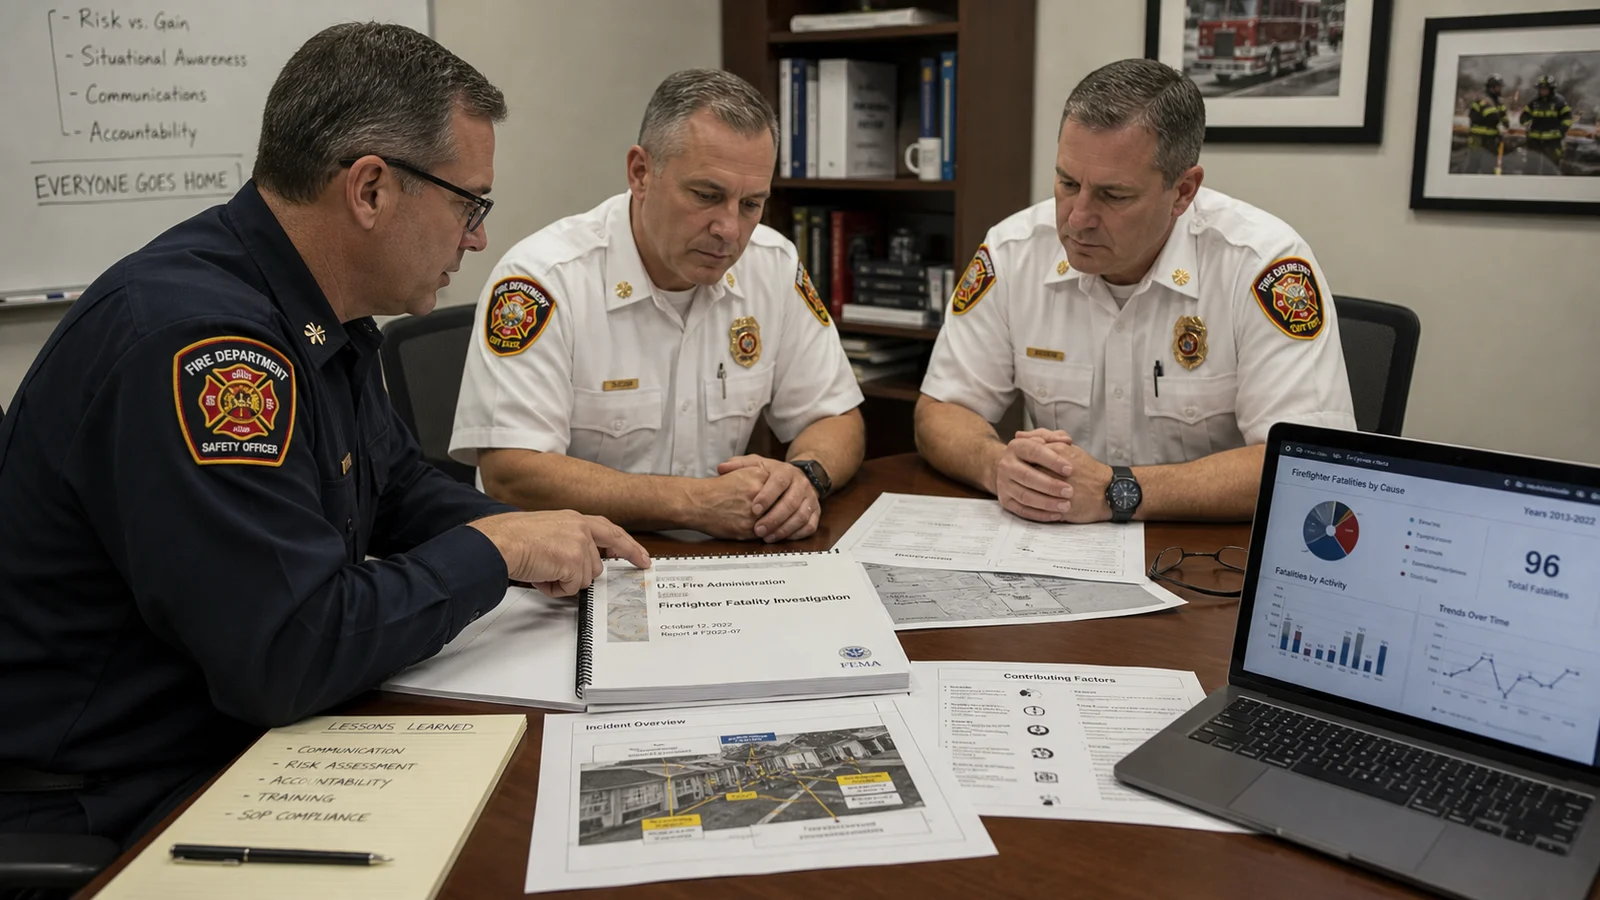
The broad 30-year trend is positive: total annual LODDs have declined from 100–150 in the early 1990s to 60–100 in recent years. But this headline improvement masks an important shift in the composition of that death toll. The deaths that have declined most dramatically are traumatic operational deaths — the ones most visible, most investigated, and most often the subject of firefighter fatality investigation reports. The deaths that have not declined proportionally are cardiovascular deaths, which have remained the dominant cause throughout the entire period.
This asymmetry reveals something about the fire service's approach to its own safety. When a firefighter dies in a collapse or a rapid fire progression event, a detailed post-incident investigation follows. The cause is analyzed, lessons are disseminated, training is modified, and equipment is re-evaluated. When a firefighter dies of a heart attack at age 52 during overhaul, the investigation is less rigorous, the dissemination less systematic, and the action items less prescriptive. The cardiac deaths are treated as somewhat inevitable rather than as the preventable occupational health failures they are.
What the Data Says About Prevention
The LODD statistics, read carefully, contain their own prescription. The interventions with the greatest potential to reduce the total death toll are not exotic or expensive:
- Annual cardiovascular medical screening per NFPA 1582. The 50% of cardiac LODD victims with no documented prior history did not have no disease — they had undetected disease. Resting EKGs, exercise stress testing, and metabolic screening find the pre-existing conditions before they kill on the fireground.
- Sleep apnea screening and treatment. OSA is the single most prevalent treatable cardiovascular risk modifier in the firefighter population. Identifying and treating it reduces hypertension, arrhythmia risk, and daytime impairment simultaneously.
- Mandatory post-shift rest before driving. Post-shift driving crashes are preventable with policy. Departments that provide bunk facilities for post-shift rest and create cultural permission to use them reduce this component of the LODD toll.
- Lightweight construction hazard training. Ensuring every active firefighter — particularly in departments with older training curricula — understands the collapse timeline of modern construction addresses the structural collapse component of traumatic deaths.
- RIT activation and accountability discipline. Consistent RIT deployment and personnel accountability at every working incident directly protects against the caught/trapped traumatic deaths that continue to occur.
Frequently Asked Questions
How many firefighters die in the line of duty each year in the US?
Between 60 and 115 per year based on the most recent decade of data from the U.S. Fire Administration. The number varies year to year based on major events. The trend over 30 years is declining, driven primarily by reductions in traumatic operational deaths. Cardiac deaths have remained persistently high throughout the same period.
What is the leading cause of firefighter LODD?
Sudden cardiac death, accounting for approximately 40–50% of all U.S. firefighter line-of-duty deaths every year — more than all traumatic causes combined. Most cardiac LODDs occur in firefighters with pre-existing but undetected coronary artery disease who experience fatal arrhythmia or acute MI during the extreme physiological demands of fire suppression or training.
Are volunteer firefighters more likely to die in the line of duty than career firefighters?
Volunteer firefighters account for a disproportionate share of LODDs relative to their operational activity. Contributing factors include less regular medical screening, less consistent physical fitness requirements, older average age in many volunteer departments, and less frequent training. Cardiac death rates are particularly elevated in volunteer firefighters.
What does "line of duty death" mean exactly?
A LODD is a death that occurs while the firefighter is actively engaged in fire department duties — emergency response, training, station duties, or administrative functions conducted in service of the department. Exact definitions vary slightly by reporting organization. The USFA definition includes deaths that occur within 24 hours of an incident if the death is determined to be a direct result of that incident.

Comments 0
No comments yet. Be the first to share your thoughts!
Leave a Comment