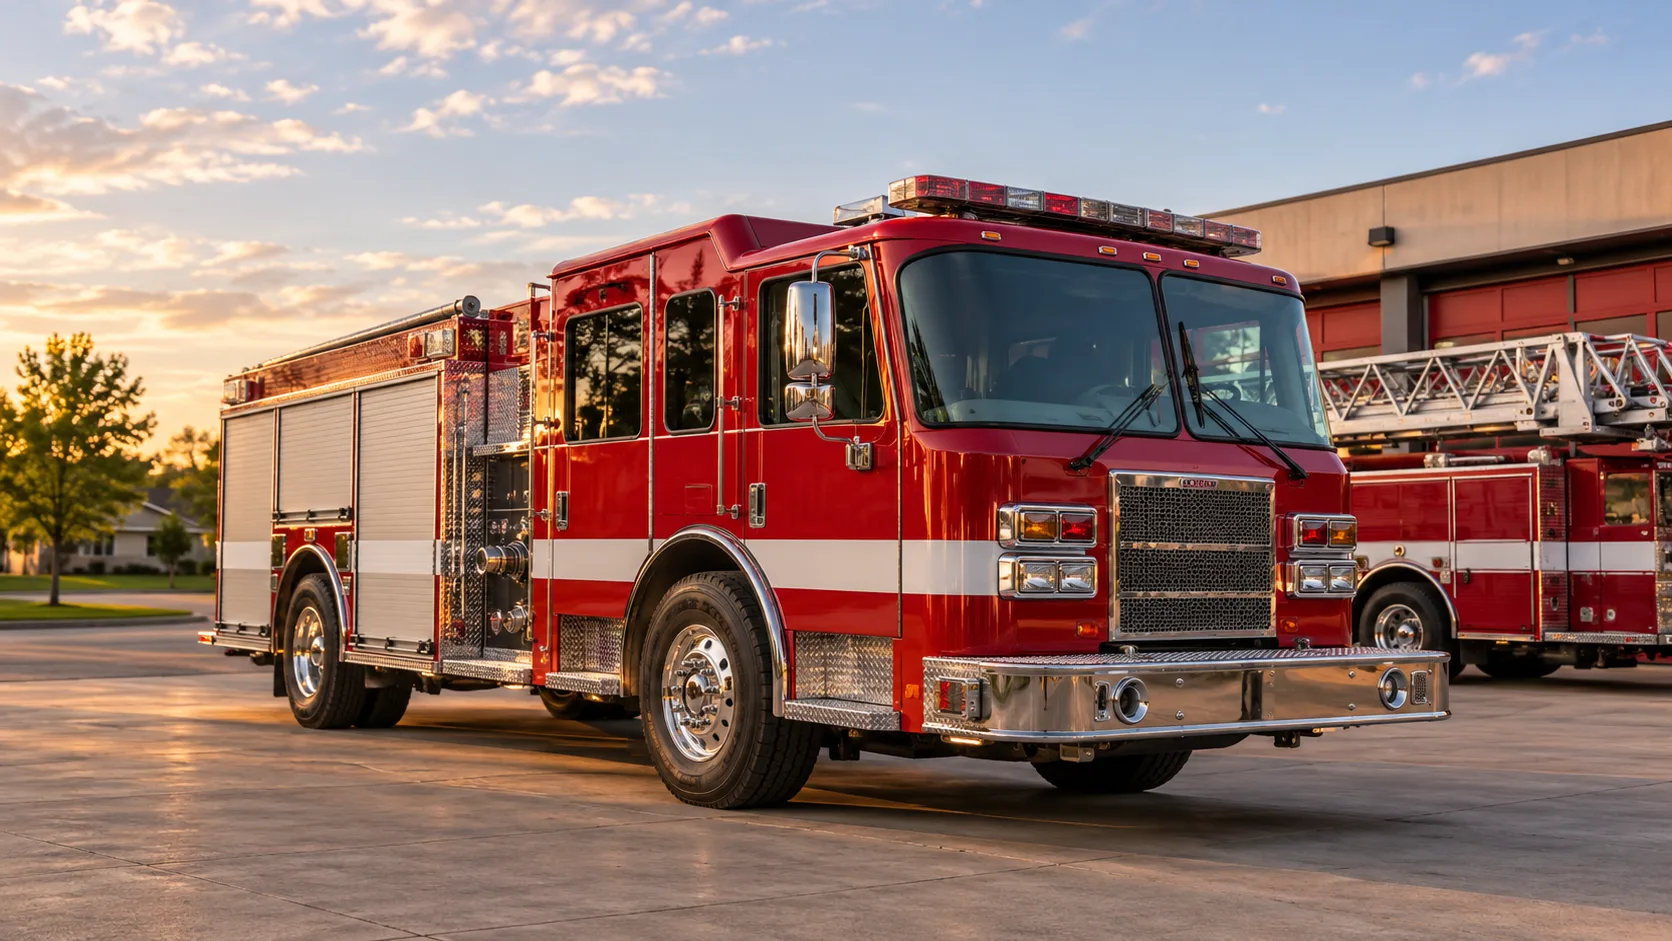
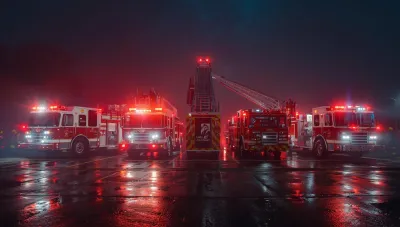
If you count by vehicle, the answer is easy: the engine. Pumpers outnumber every other kind of fire truck in the country, and they are the rig most departments buy first, replace most often and run the hardest. Past that, the picture changes depending on what you count: trucks on the road, trucks on order, or trucks in a typical department’s bays. This guide puts the NFPA, USFA and FAMA numbers side by side.
How many fire trucks are there in the US?
There is no current public count broken out by vehicle type. The best figures are NFPA estimates, which a 2020 report for the Fire Apparatus Manufacturers’ Association (FAMA) summarized this way: about 66,400 pumpers, 7,200 aerial apparatus and 71,900 other suppression vehicles as of 2015 to 2017. NFPA’s pumper count in that chart tracks the larger pumps (the chart labels them 1,000 gpm and up), while smaller pumpers, brush trucks, tankers and hose wagons fall into “other suppression vehicles.” Treat these as estimates, not an inventory.
The typical department is small
Most American fire departments are small and run by volunteers, which explains a lot about what the average fleet looks like. NFPA estimated 29,452 fire departments in 2020. Of those, 18,873 were all-volunteer (64 percent), 5,335 were mostly volunteer (18 percent), 2,459 were mostly career (8 percent) and 2,785 were all-career (9 percent). The USFA National Fire Department Registry, a voluntary list, counted 52,309 fire stations in January 2024.
What a typical fleet looks like
NFPA’s Fourth Needs Assessment (2015) found that the average department had 3.55 engines in service, 0.81 ladder or aerial apparatus and 1.05 tankers, plus 0.81, 0.16 and 0.04 of those in reserve. That is fewer than one ladder truck per department. Because so many departments are small, a lot of them have no aerial at all, and the older NFPA studies flagged departments with tall buildings in town but no ladder. A FAMA survey of more than 680 departments found that 80 percent had fewer than ten vehicles across front-line and reserve fleets, and NFPA’s average fleet size was 7.94 vehicles in 2015, ambulances included.
The most common types, by what the data shows
No single source ranks every type, so the table below shows what each one tells us. FAMA figures are units booked by its member companies in North America in 2019, mostly in the United States.
| Type | What the data shows |
|---|---|
| Engine / pumper | About 66,400 in service (NFPA est.). 2,729 booked in 2019, roughly 57% of all units booked over time (FAMA). |
| Tanker / tender | About 1 per department in service (NFPA). 538 rectangular and elliptical tankers booked in 2019 (FAMA). |
| Ladder / aerial | About 7,200 in service, 0.81 per department (NFPA). 661 booked in 2019 (FAMA). |
| Brush / wildland | Fastest-growing category for bookings from 2014 to 2019 at 6.9% a year, though orders fell 27% in 2019 after a spike in 2018 (FAMA). |
| Rescue | 223 non-walk-in and 84 walk-in rescues booked in 2019. Non-walk-in bookings were 528 in 2014 (FAMA). |
| Command vehicle | 12.1% of surveyed departments planned to buy one (FAMA survey). |
| ARFF (airport) | 196 booked in 2019. 2.3% of surveyed departments planned to buy one (FAMA). |
Engines: the default rig
An engine carries a pump, a water tank and hose, and it covers fires, crashes and medical calls. The pumper is the first vehicle most departments buy and the one they replace most often. When FAMA asked departments what they planned to buy in the coming year, pumpers led by a wide margin: 29.7 percent of respondents, ahead of command vehicles (12.1), tankers (10.5), brush trucks (10.4), aerials (8.0) and rescues (7.9). Intentions are not sales, and FAMA noted that survey plans and actual bookings often do not match, but the ordering is consistent with the sales numbers. See inside a modern pumper and the driver/engineer pump operations guide.
Tankers: the rural workhorse
Departments without hydrants depend on tenders. Pierce Manufacturing told a Senate subcommittee in September 2025 that rural departments often run tankers of 2,000 gallons or more. Tankers are old on average: NFPA’s Fifth Needs Assessment found 58 percent of tankers in service were at least 15 years old. See tanker operations and the tanker shuttle calculator.
Ladders and aerials
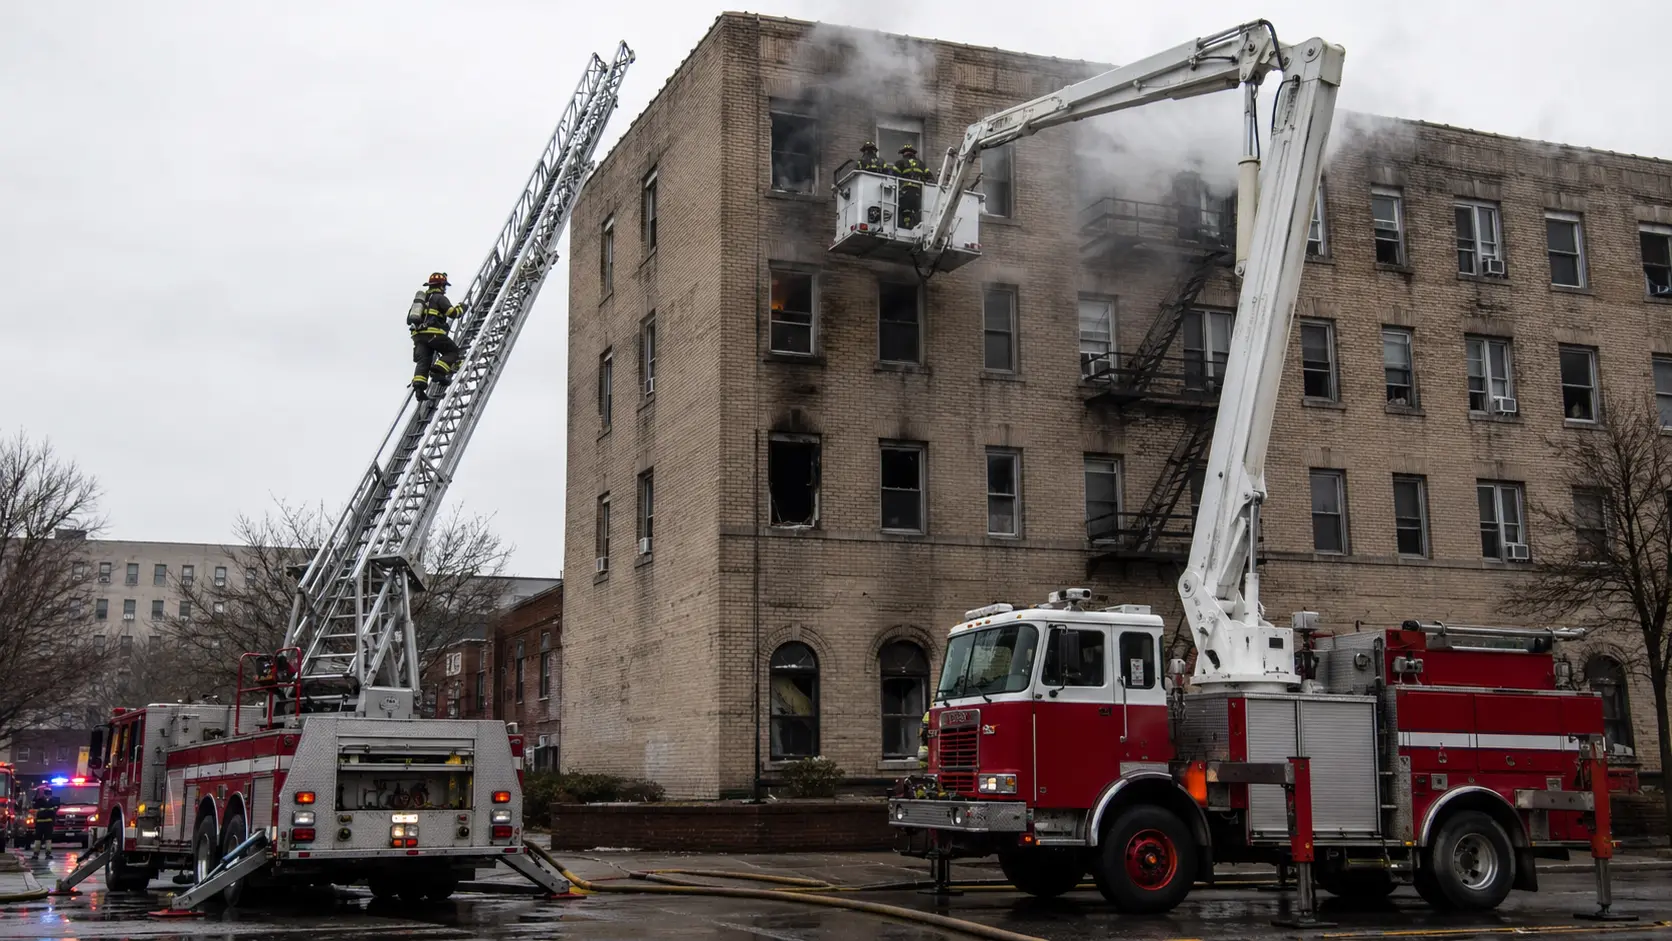
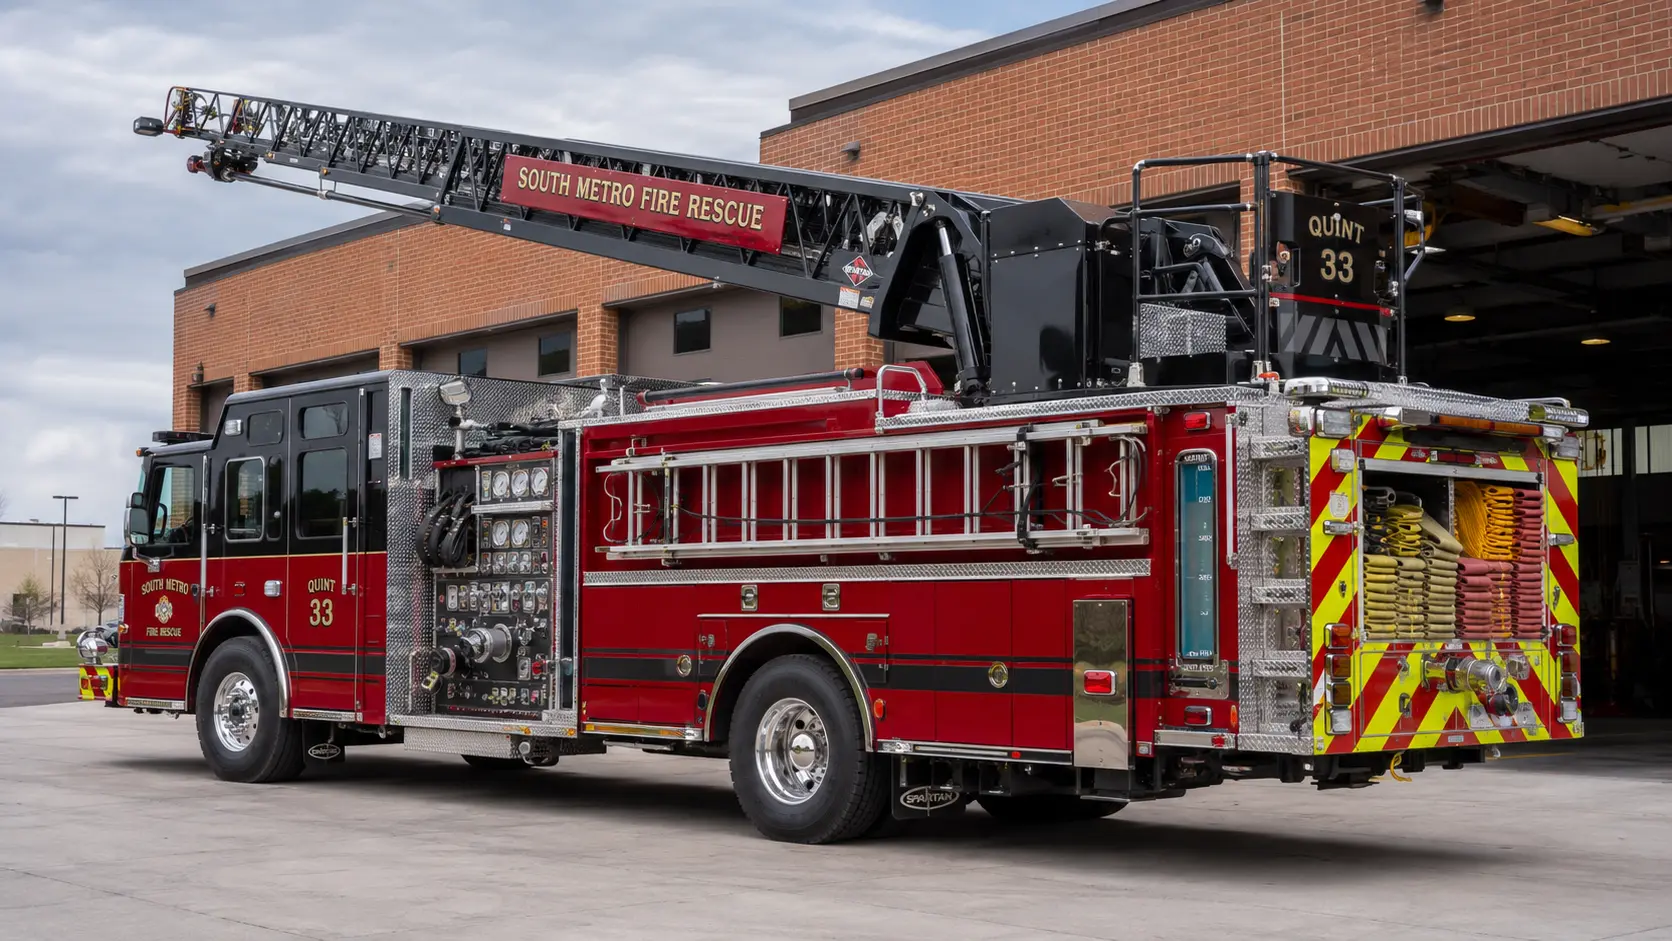
City departments run trucks with aerial ladders of 100 feet or more, as the same Pierce statement noted, and Fire Apparatus Magazine describes 100 feet as a typical length for an aerial. The big spread between small and large departments shows up here: smaller communities are more likely to have older aerial apparatus, and NFPA found 41 percent of ladders and aerials in service were more than 15 years old. For the design choices, see aerial ladder vs articulating platform and the aerial ladder reach calculator. A quint is the option for departments that want both functions on one rig.
Brush trucks, rescues, command and ARFF
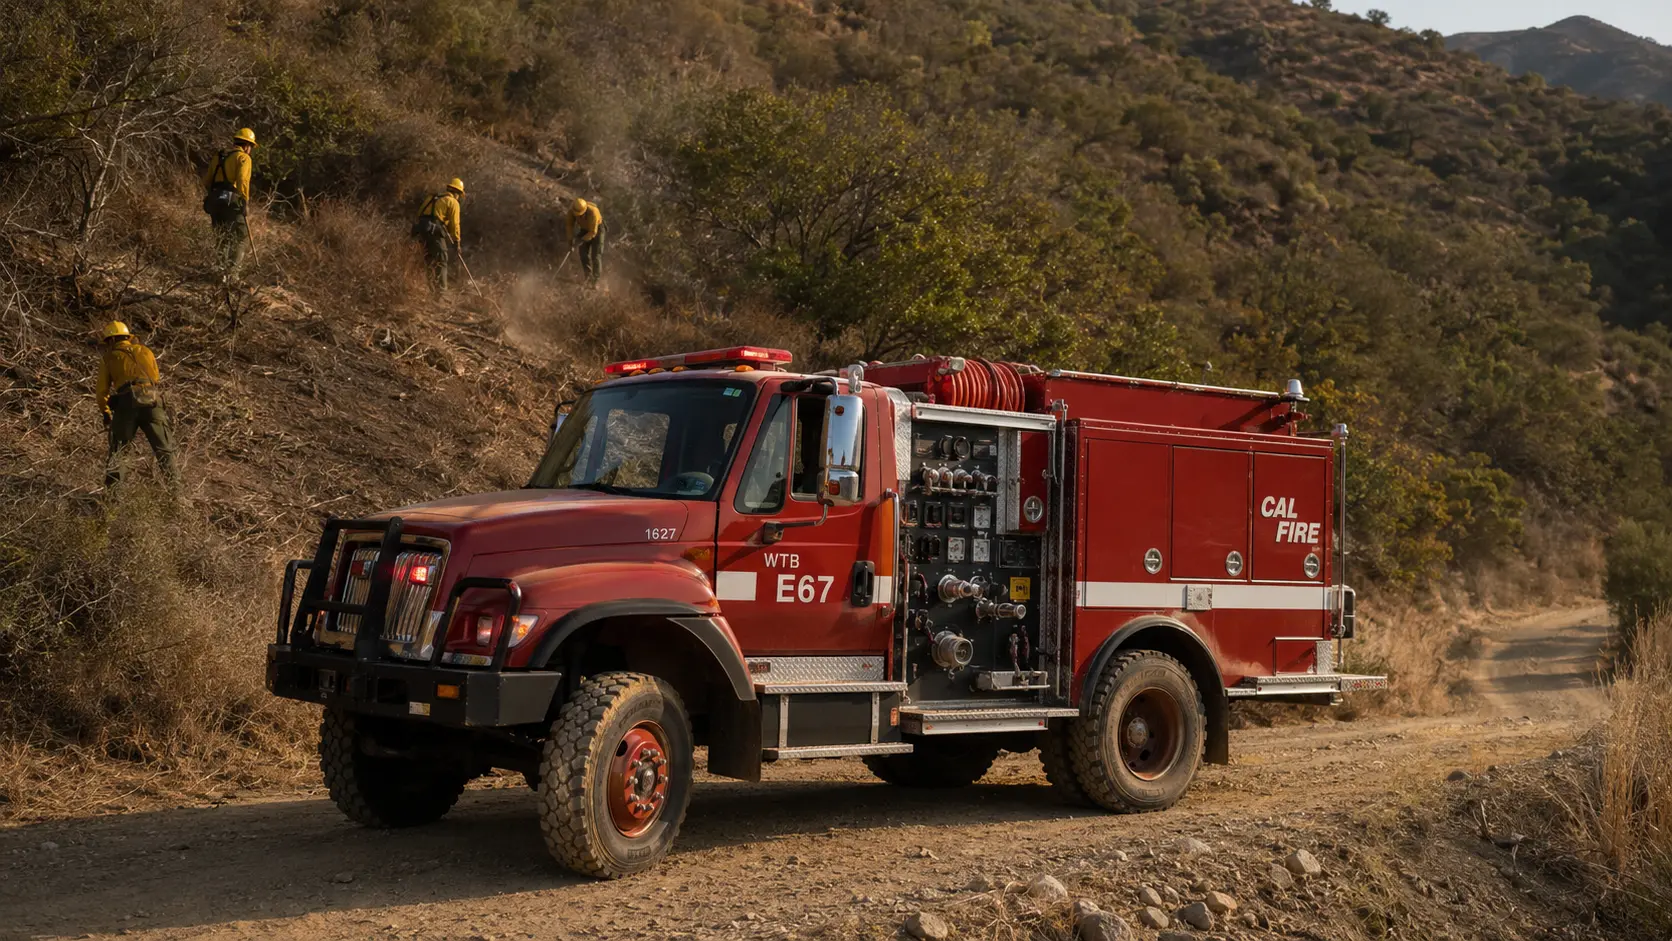
These are less common in raw numbers, but each is growing or holding steady for local reasons. Brush trucks are bought in wildfire-prone regions (Type 3 engines and brush trucks). Rescues shifted over the last decade toward walk-in designs as the non-walk-in market shrank. ARFF trucks are specialized and few. For what a rescue carries, see heavy rescue units, and for the whole family tree, the fire apparatus guide.
How old is the fleet?
NFPA’s Fifth Needs Assessment (surveyed 2020 to 2021) found that 49 percent of engines and pumpers in responding departments were at least 15 years old. Nearly two-thirds (64 percent) of engines in the smallest communities were that old. The share has come down over the long run: in the Fourth assessment it was 43 percent, and in 2001 it was 51 percent, but aging fleets have not gone away. The FAMA analysis also points out that fewer than half of U.S. departments have a plan to replace apparatus on a regular schedule (43 percent in 2015), which helps explain the age profile.
Who builds the trucks?
Most new American fire trucks come from three corporate groups: REV Group (E-ONE, KME, Ferrara, Spartan ER, Smeal and others), Oshkosh Corporation (Pierce Manufacturing) and Rosenbauer America. In an April 2025 letter, two senators put their combined share at an estimated 70 to 80 percent. IAFF testimony put REV Group at roughly a third of a market of about $3 billion a year, Oshkosh at about a quarter and Rosenbauer at 8 percent. Other builders, including Sutphen and Seagrave, make up the rest along with regional body builders. Pierce told the Senate it competes with “dozens” of manufacturers.
The concentration has drawn a Senate subcommittee hearing in September 2025, and the IAFF reports an FTC investigation and civil lawsuits alleging anticompetitive conduct. Those are allegations, and this guide does not take a side.
What is changing: lead times and prices
Before the pandemic, Pierce says U.S. fire truck orders ran at about 4,000 a year across all manufacturers from 2013 through 2019, of which Pierce received about 1,470 a year, and custom trucks took 12 to 18 months to build. Pierce says demand rose 45 percent in 2022 over the pre-pandemic average. The IAFF says some departments are now waiting years for a truck, and the senators’ letter cited a report putting a ladder truck at about $2.3 million, nearly double what it cost a few years earlier. Both figures are claims by interested parties, so check current quotes before you budget.
How to read these numbers
- FAMA counts units booked by its member companies in North America, including Canada (328 of 4,762 units in 2019). It does not count every truck sold.
- NFPA numbers are survey-based estimates, and the most recent complete vehicle counts are several years old.
- Surveys of purchase plans show intent, not sales.
- “Most common” depends on the question. Engines win on every count. The ranking below engines depends on whether you mean trucks in service, trucks per department or trucks ordered.
Frequently asked questions
What is the most common fire truck in the US?
The engine, or pumper. NFPA estimated about 66,400 pumpers in the 2015 to 2017 period, and FAMA data show pumpers made up roughly 57 percent of new units booked over the years.
How many fire engines does the average department have?
NFPA’s Fourth Needs Assessment found 3.55 engines in service per department on average, plus 0.81 in reserve. Most departments are small, so many have far fewer than that and large cities have far more.
How common are ladder trucks?
Less than engines. NFPA estimated about 7,200 aerial apparatus and an average of 0.81 ladders per department. Smaller communities are more likely to have no aerial at all.
How old are fire trucks in the US?
NFPA’s Fifth Needs Assessment found 49 percent of engines and pumpers, 41 percent of ladders and aerials and 58 percent of tankers were at least 15 years old.
Who makes most U.S. fire trucks?
REV Group, Oshkosh (Pierce) and Rosenbauer America. Senators estimated their combined share at 70 to 80 percent, and the IAFF put it above 70 percent.
Sources and updates
- NVFC volunteer fire service fact sheet (NFPA U.S. Fire Department Profile 2020 data)
- USFA National Fire Department Registry Summary, January 2024
- FAMA / Sage Policy Group: The Fire Apparatus Industry, An Update (V3, March 2020)
- FAMA / Sage Policy Group: The Fire Apparatus Industry, An Update (V4, April 2021)
- NFPA: Fifth Needs Assessment of the U.S. Fire Service (2021)
- Pierce Manufacturing statement, U.S. Senate subcommittee, Sept. 10, 2025
- IAFF statement, U.S. Senate subcommittee
- Sens. Hawley and Kim letter to REV Group, Oshkosh and Rosenbauer
- IAFF: What to know about the fire truck crisis
- Fire Apparatus Magazine: 100 Feet and More
Editorial note: Counts are estimates from NFPA surveys and FAMA member data and will differ from other sources. Market share figures are claims made to the U.S. Senate and in public statements, not audited numbers. Cover image is AI-generated and does not depict a specific vehicle or department.

Comments 0
No comments yet. Be the first to share your thoughts!
Leave a Comment